black and brown leather padded tub sofa

Transforma tus datos en decisiones

Consultoría y analítica de datos para pymes, optimiza tu negocio con cuadros de mando que te ayuden a conocer la situación de tu empresa y a optimizar procesos

Consultoría de Datos

Transforma tu información en decisiones estratégicas para optimizar el crecimiento de tu negocio.
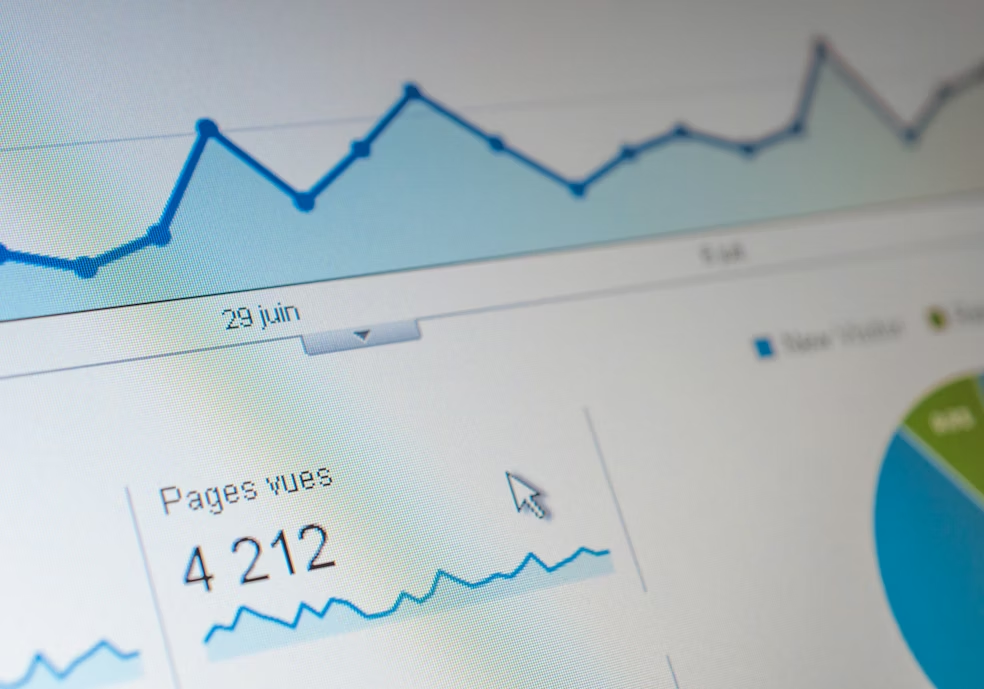
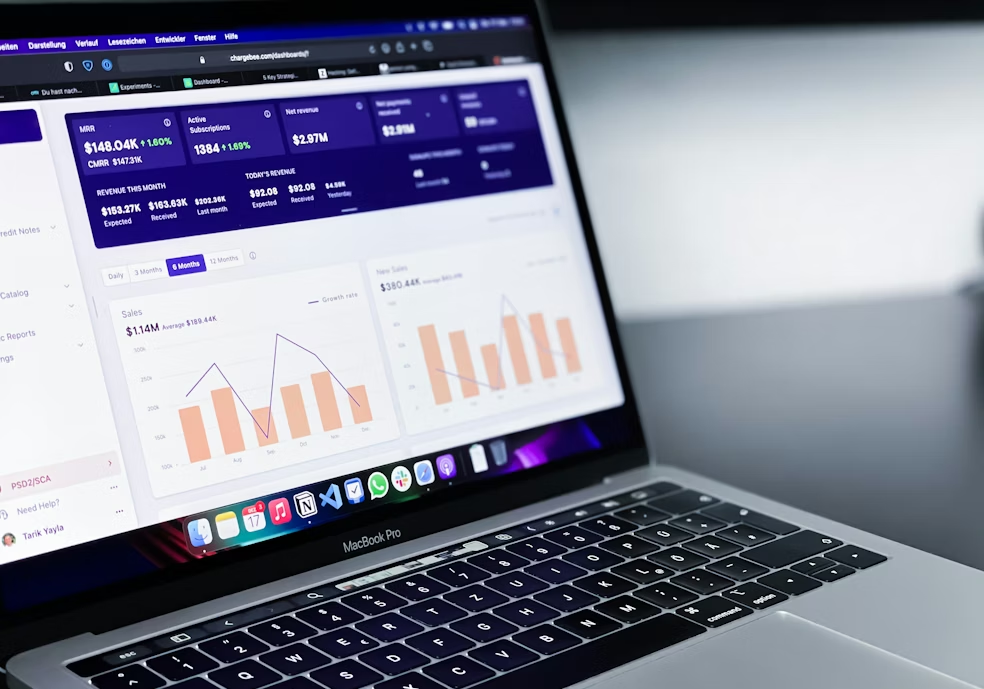
Cuadros de Mando

Desarrollo de dashboards personalizados que facilitan la toma de decisiones y mejoran la gestión empresarial.

A computer screen displaying a data analytics dashboard with graphs and charts. A blue line graph shows fluctuations in data over time, and a section highlights the number of page views. A pie chart is partially visible, indicating a breakdown of different data elements.
Análisis Avanzado

Análisis detallado que permiten identificar oportunidades y mejorar procesos en tu empresa.

Olvídate de trabajar con decenas de ficheros y hojas de cálculo. Gestiona tu empresa de forma eficiente.

Optimiza procesos
A laptop with an open screen displaying dashboard analytics featuring charts, graphs, and numerical data related to sales and subscriptions. The interface is predominantly dark-themed with sections highlighting key performance metrics. The device shown is a MacBook Pro, indicated by the keyboard layout and branding.
An iPad displaying data visualization content next to a book titled 'Data Science for Business.' The iPad is showing notes and a diagram about dashboard design, accompanied by a stylus placed between the iPad and the book.

Transforma tus datos en decisiones

Somos expertos en análisis de datos, especializados en ayudar a pymes a centralizar su información y optimizar procesos mediante consultoría y cuadros de mando efectivos

An abstract, pastel-colored, 3D-rendered representation of data analysis and search engine optimization (SEO). The image features a computer interface with various analytics symbols, including a magnifying glass, bar charts, pie charts, and a search bar with the text 'SEO'. Surrounding the interface are different objects such as a potted plant, a cup with a saucer, and a megaphone, all placed on a light green background.
Tu aliado en datos
Impulsa tu negocio hoy

Olvídate de ficheros desactualizados y opta por soluciones personalizadas en analítica de datos, utilizando herramientas avanzadas que te ayuden a mejorar la gestión de tu empresa

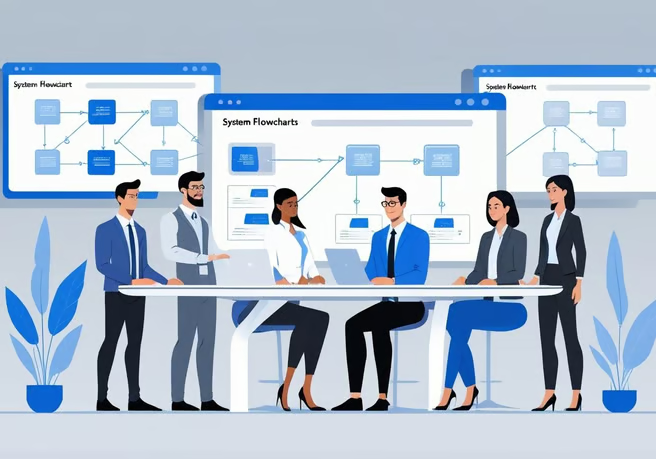
Integraciones y Desarrollos a Medida

Soluciones tecnológicas que conectan tus sistemas, automatizan procesos y potencian la eficiencia operativa de tu negocio.

Integración de sistemas

Conecta tus aplicaciones, plataformas y bases de datos para que compartan información sin fricciones. Automatiza flujos y elimina tareas manuales repetitivas.

Consultoría IT

Cuéntanos tus necesidades e inquietudes tecnológicas y te asesoraremos para que cubras tus necesidades de forma eficiente para alcanzar tus metas.

Creamos software adaptado 100% a las necesidades de tu empresa. Desde apps internas hasta paneles de control o módulos específicos que no encuentras en el mercado.

Desarrollo a Medida
woman wearing yellow long-sleeved dress under white clouds and blue sky during daytime

Gracias a Ziurdata, centralicé mis datos y mejoré la toma de decisiones en mi negocio.

María López

A digital dashboard displaying various analytics charts and graphs. There is a line graph showing user engagement over time on the left, a section with total revenue marked as $74K, and bar charts illustrating user statistics by region. The central section highlights users in the last 30 minutes, focusing on different countries such as the United States, Canada, India, Pakistan, and Brazil.

El servicio de consultoría de Ziurdata transformó nuestra gestión de datos y optimizó nuestros procesos.

Carlos Ruiz

A person is holding a smartphone displaying an analytics or insights screen with various metrics and numbers. The individual is wearing a casual white shirt and a watch with a black band. The surrounding environment includes an indoor plant.
★★★★★
★★★★★

Contáctanos

¿Hablamos de tu proyecto? Ponte en contacto con nosotros y te responderemos a la mayor brevedad posible para concertar una reunión y que nos cuentes cuáles son tus necesidades